 UPCOMING WEBINAR: From Thousands of Tables To One Clear Story: using AI in survey analysis
 Explore mode allows the user to explore the data and save the outputs for future use. Viewers of a published document can Explore existing charts and tables or create their own.
In Explore More, the user has access to some of the same controls that are available in Edit mode. Any tables or charts created in Explore mode will be available only to the user who created them. To save the outputs for later use, the user needs to be logged in and have the appropriate access rights to the company Displayr account.
This article describes how to access and use Explore mode.
Requirements
- A Document published as a webpage, either using Login and password required or Anyone with the link, with the Explore Mode option selected. See: How to Publish a Document as a Web Page (Dashboard) for more information.
- You'll need a Displayr account. Login details are only required if you wish to save your Explore Mode work in future sessions.
- Access to the Document.
- Viewers must be members of a user group with Explore Mode enabled, see: How to Enable Explore Mode for User Groups
Method
- Open the published Document and click on the Explore button.
-
Select Create Table or click on an existing table or chart on the Page.
Note: Statistical analyses and items created using the Visualization menu are not available to explore (e.g., MaxDiff).When you select Create Table, Displayr will create a table showing the breakdown for the first available variable in the data set. If you select an existing table and chart, Displayr will open a new page showing the selected output.
- Create the desired output by using options from the seven menus as detailed below.
Explore
- The Copy and Delete buttons allow you to copy or delete your existing table/chart output. You can also use the Copy button to create a new table.
- The Name field is the reference name of the table/chart you've created. This can be altered as needed.
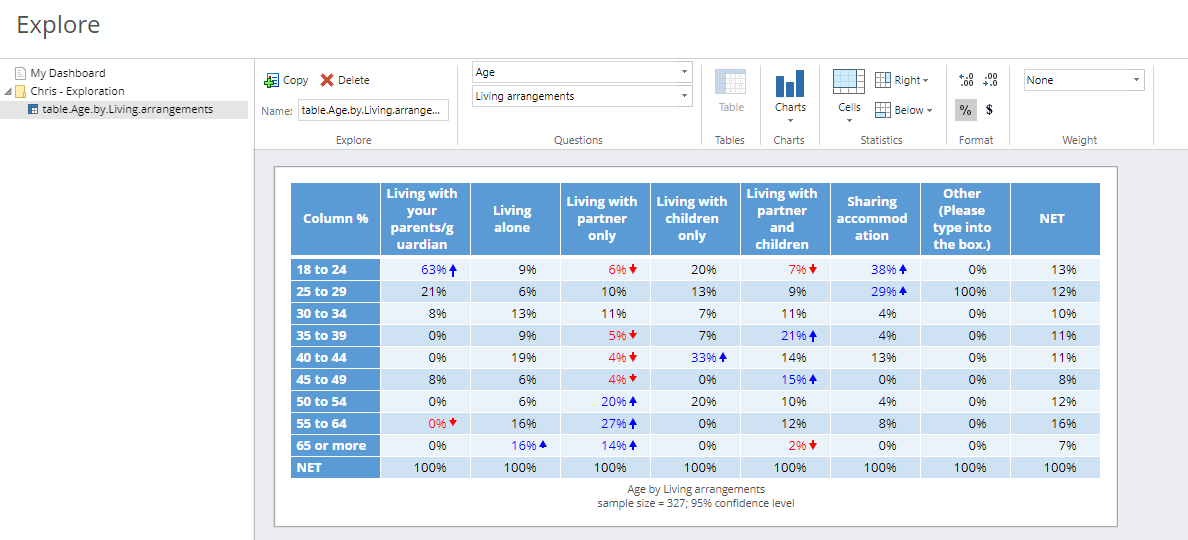
Questions
These two drop-down menus allow you to select the questions (variable sets) you wish to show in your table/chart.
The first drop-down corresponds to table rows and the second drop-down to columns.
Tables and Charts
- Select the Table button to switch a chart output back to a table.
- Select the Visualization button to open the Visualization menu to choose the desired type.
Statistics
The Statistics section allows you to select the statistics you wish to appear in the table.
- Select the Cells menu to add statistics to the cells of the table.
- Select the Below to add column-level statistics to the bottom of the table.
- Select the Right to add row-level statistics to the right end of the table.
Format
- Use the top two buttons to increase or decrease the number of decimal points displayed in the output.
- Select the % sign to add or remove % signs from the table.
- Select the $ sign to add or remove the currency symbol to money values.
Weight
Any weights available in the Document will appear in the weight drop-down menu. Select the weight to apply it to the data in the table/visualization.
Filter
Any variable sets ticked as Usable as a filter are available by default in Explore mode (and View Mode) for users to apply them to outputs (and pages). If you'd like to remove a filter from the list available to users in Explore mode, in the variable set's Properties, you need to check Hidden in Explore Mode. Users can also create their own, see How to Create and Apply a Filter in Explore Mode.