Displayr provides a greater productivity dividend than Qualtrics, because:
- It is easier to integrate and modify data
- More work can be automated
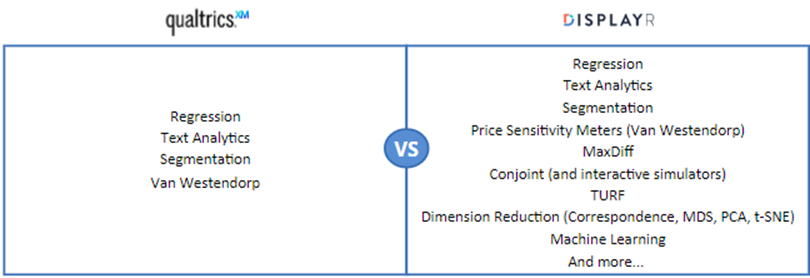
- More advanced analyses
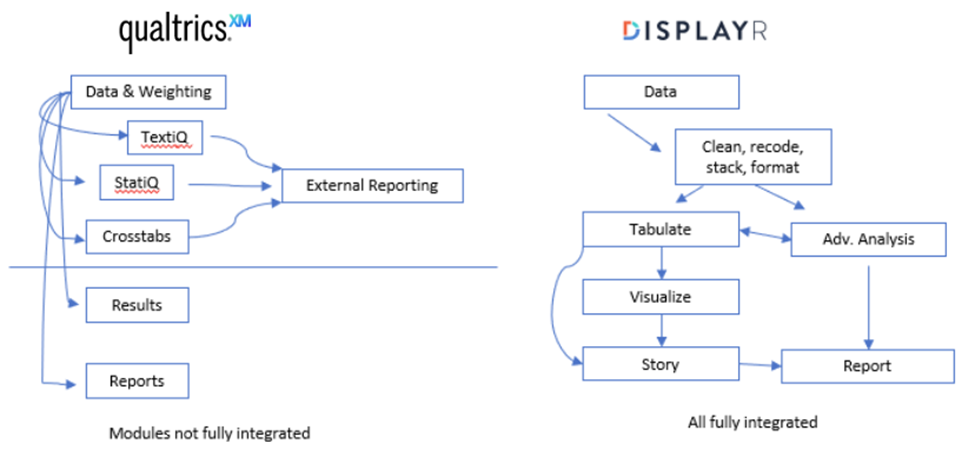
- Analysis and Reporting is more integrated
- Your team can work in parallel
It is easier to integrate and modify data
Bring in all your data sources and link them together in Displayr into a single document:
Displayr will automatically recognize the structure of your data and allow you to run scripts to quickly modify variables for your analyses. You can stack your data and combine it with multiple data sources, all in the same application.
More work can be automated
By virtue of performing more stages of the data value chain, Displayr can automate more of your work. See Automatic Updating, Duplicate & Modify, and Extensibility.
More advanced analyses
Do more of your analysis in Displayr instead of exporting to another tool.

Analysis and Reporting are more integrated

With Displayr, everything exists on the same page, there’s never a reason to switch to a different module.
Your team can work in parallel
Displayr allows multiple users to edit the same document at the same time. No more waiting for other people to finish their work before you can do yours.
Next
How to Import Data from Qualtrics
How to Set Up and Export a Choice-Based Conjoint Analysis in Qualtrics
 UPCOMING WEBINAR: 10 Market Research Predictions Over the Next 4 Years